
A Midseason Review of the 2025 Chicago White Sox Bullpen
- Sean

- Jul 17, 2025
- 11 min read
At the 2025 All-Star break, first-year manager Will Venable and the Chicago White Sox find themselves at the bottom of the American League Central with a 32–65 (.330) record. Coming off of the historically terrible 2024 season, White Sox fans were hoping for anything better than what they experienced last year. There have been some bright spots and moments of excitement with all of the rookies that have made their debuts this year, but once again the offense has been struggling to score runs and the bullpen has largely failed to hold down leads or keep games close. Since I spend way too much time thinking about bullpen management and decision making, I thought that it would be fun to do a “just past the mid year point” review of the White Sox bullpen performance as well as how well Venable has been deploying his relief pitchers. We will start with evaluating team level performance, we will then look more closely at the players currently on the roster and their performance, we will follow that up by evaluating Venable’s pitching change decision making, and we will close it out with my own attempt at creating a bullpen strategy plan for the current roster. Let’s get into it!
Team Level Review

As you can see, there is a lot more red (bad) than blue (good) next to the White Sox. Before diving into more detail, let’s talk about why I chose the metrics that I did.
Fielding Independent Pitching (FIP): FIP estimates a pitcher's run prevention independent of the performance of their defense (K, BB, HBP, and HR). While it’s not perfect, it is generally a better representation of performance than ERA. For FIP, lower values are desired.
Expected Fielding Independent Pitching (xFIP): xFIP builds off FIP but seeks to eliminate some of the variation experienced with home runs. It provides a clearer picture of a pitcher’s underlying skill. For xFIP, lower values are desired.
Strikeout Rate (K%): It isn’t perfect, but it does point to a pitcher’s ability to miss bats and keep the ball from going in play. If there are men on base, we want to know who we can count on to keep them from advancing. For K%, higher values are desired.
Walk Rate (BB%): Similar in sense to K%, BB% points to a pitcher’s ability to avoid self-inflicted damage. It’s a valuable skill to be able to limit the amount of free passes one provides to batters. For BB%, lower values are desired.
Ground Ball Rate (GB%): Given that bullpens can be utilized situationally, it’s good to understand how often your players induce ground balls. If a team is in need of a double play, it’s helpful to know who can be tabbed to turn two. For GB%, higher values are desired.
Hard Contact Rate (Hard%): Hard% points to the quality of contact that is being given up. Typically, harder hit balls have more disadvantageous outcomes for the team pitching, so it’s best to keep it as low as possible.
Context Neutral Wins (WPA/LI): WPA/LI is a little more tricky to understand, but as simply as I can put it, it shows us whether a pitcher added win probability regardless of the situation (leverage). Due to the removal of leverage, it provides more of a measurement of a player’s talent than WPA alone. For WPA/LI, higher values are desired.
Shutdowns to Meltdowns (SD:MD): SD:MD is a simple ratio that tells us whether teams are able to protect leads instead of lose them. For SD:MD, higher values are desired.
Roster Similarity Plus (RS+): RS+ is a team’s pitching roster similarity (using Jaccard Similarity) over the course of the season, but turned into an index so that it’s easy to interpret just how much more similar or less similar a team’s pitching roster has been compared to the league average. The less new guys added to the roster, the higher the RS+. While a higher RS+ isn’t necessarily clearly correlated with team level success (mixed results looking at 2023 and 2024), I’d argue that having less turn over is a good thing from the perspective that you better know your players and how to effectively deploy them.
As you can put together, none of these metrics perfectly capture performance but used with each other, they help paint a better picture.

Back to the White Sox, they grade out quite poorly when comparing them to each of the other teams in the league. You can see that they are near the bottom in all categories but Hard%. When looking at their performance from a situational perspective, it leaves you wondering who Will Venable can turn to when the team needs a strikeout or to induce a double play. Perhaps it doesn’t hurt that his pitching staff has had less stability than all but two other teams. So not only has Venable not had adequate performance from the players he has had, he has also had the challenge of learning new players and figuring out how to put them in the best situation to succeed.
Player Level Breakouts
To better understand what Will Venable and the White Sox have moving into the second part of the season, we should evaluate the performance of the players that currently make up their bullpen. For this assessment, we will largely lean on the same metrics, but will break them out by handedness splits. Meaning that, we will look at each pitcher versus Right Handed Batters (RHB) and Left Handed Batters (LHB). It is important to break it down in this way so that we can better understand who can be leaned on and avoided given certain matchups.
Jumping into the versus RHB split, you can see that the White Sox don’t really have any good options to lean on. Using FIP to make a first pass, Grant Taylor stands out but it’s worth noting that his sample is a pretty small sample with only 28 batters faced. Regardless, his performance so far is intriguing and even with some regression, he can still be thought of as a go-to option to shut down right handed batters. After Taylor comes Steven Wilson, Brandon Eisert, and Tyler Alexander.

Looking at it from the opposite perspective, it’s quite clear that Tyler Gilbert has struggled mightily against right handed batters this year. He's faced 63 right handed batters, which makes up 57% of the batters he’s faced. Unfortunately his FIP and xFIP are in lock step and are north of 6 - which is not good. He’s not driving strikeouts, he’s giving up too many walks, and he’s not inducing enough ground balls. Another guy struggling versus right handed batters is Jordan Leasure. While his K% is on the higher end for the team at 23.2%, his FIP (4.86) and BB% (14.1%) leave much to be desired. Leasure’s usage has been focused on right handed batters (64% of his batters faced) and suggests that perhaps his usage should be more limited. Granted, things get a bit murky when throwing xFIP in the mix, as his 4.57 xFIP is third best on the team. So, we can lean on FIP with the hope that it drops closer to his xFIP over time.

Taking insights from the table above and turning them into a high level takeaway, we can plot players by the percentage of their batters faced being right handed by their FIP. Here, it becomes easy to understand which pitchers may be overexposed versus right handed batters, who is well matched, who is underutilized, and who is properly being sheltered. It’s important to note that this is relative to who is currently available in the bullpen - thus the quadrants could shift with players added or subtracted.

Moving on to the versus LHB split, you can see that the Sox actually have some solid options available to them. Once again using FIP to take a first pass, Tyler Gilbert leads the way with a 1.66 FIP, followed by Grant Taylor with a 1.97 FIP, and lastly Tyler Alexander with a 2.88 FIP. If needed to extend our view past these three guys, we can point to Jordan Leasure and Dan Altavilla given the large difference between their FIP and xFIPs - with their xFIPs being much lower and thus suggesting that they’ve been unlucky versus left handed batters.
After this, it’s quite clear that the rest of the bullpen really struggles against left handers. Steven Wilson, Mike Vasil, and Brandon Eisert each leave much to be desired versus left handed batters with them having FIPs north of 4.5 and even eclipsing 6.6 in Wilson’s case. Luckily the Sox appear to be aware of this and each of Wilson, Vasil, and Eisert primarily face right handed batters.

Mimicking what we did for the right handed batter breakout, we can do the same for pitchers versus left handed batters. Some of the insights above go against this chart a bit given that I call on FIP for the chart and xFIP in the readout. But if we lean on the chart as a starting point, we see that there may be an opportunity for shifting more of Tyler Gilbert's and Tyler Alexander’s workloads from RHBs to LHBs.
Bullpen Strategy Evaluation
With an understanding of the bullpen’s overall performance as well as the performance splits of each of the players currently in the White Sox bullpen, the only other piece we are missing for our evaluation is to investigate Will Venable’s bullpen management and strategic decision making. Luckily, I have a project that I maintain that does just this. If you’re not familiar with the Pitching Change Decision Making framework, you can learn more about it here. But from a high level, I am evaluating how often managers make pitching changes where the player inserted into the game is expected to outperform the previous pitcher as well as the pitchers available in the bullpen. The evaluation takes place at the pitcher and batter level. Additionally, the final grade that I produce accounts for the leverage at the time of the pitching change, so decisions made in high leverage situations will be more heavily rewarded or penalized than those made in low leverage situations. The framework is not perfect and makes some assumptions, but it is a solid approach to evaluating decision making in regard to pitching changes.

Through the All-Star break, the Chicago White Sox have a Pitching Change Decision Making Score (PCDMS) of 88.2 which is good for 26th in Major League Baseball (MLB). This score is made up of three components. The first component strictly evaluates the decision through the lens of evaluating the chosen pitcher versus the pitcher they are replacing against the batters needed to satisfy the three batter minimum rule. This seeks to answer “they chose this pitcher, but would the previous pitcher been a better choice?”. Here, their score is 94.2 which is 20th in MLB. This suggests that despite their low overall score, they are closer to the middle of the pack when it comes to choosing a good option to replace the previous pitcher. The second component also evaluates the decision through the lens of the three batter minimum rule but instead pits the pitcher chosen versus all of the pitchers still available in the bullpen. This seeks to answer “they chose this pitcher, but were there better options available?”. Here, the White Sox have a score of 84.1 which is 28th - which suggests that they may want to focus more on choosing better options given the matchups. The last component deviates from the other two and instead focuses on each batter after the three batter minimum rule is satisfied and evaluates the pitcher chosen versus the pitchers still available in the bullpen. This seeks to loosely answer “did they leave the pitcher in too long?”. For this component, the White Sox have a score of 87.1 which is 24th. As you can put together, this score suggests that they may want to consider making the call sooner to replace a pitcher given the upcoming matchups.

Now that you have a high level understanding of how the framework views Will Venable’s decision making, it may help to provide context at the player level. Afterall, the individual decisions to make pitching changes are what is driving these scores. To dive into a few players, Brandon Eisert leads the White Sox with 38 relief appearances so far. Out of these 38 appearances, the framework has favored him over the pitcher he was replacing, against the batters needed to satisfy the three batter minimum rule, 65.8% of the time. When comparing him to the other pitchers available in the bullpen, he was favored exactly 50% of the time. When comparing him against the previous pitcher and the other pitchers available, he was favored 39.5% of the time. You may notice “Good Outcome %” which is for each of these relief appearances, how often did he allow less runs than the expected runs state at the time of entry into the game. In Eisert’s case, this sits at 60.5% of the time.

A good example for a player that is hurting the White Sox score is Jordan Leasure. We already touched on his performance for the season, which hasn’t been great, and as you can see, the framework only favored him versus the previous pitcher 43.2% of the time, versus the options available in the bullpen 18.9% of the time, and versus both only 8.1% of the time. To make matters worse, Leasure leads the White Sox with a gmLI of 1.8 - which means on average, he is coming in at higher leverage situations than others on the team. So the combination of not favoring the matchups as well as those matchups occurring in higher leverage situations is hurting the White Sox scores in each of the components.
As an aside, if you want to dig in more to the team scorecards, player breakouts, or even specific decisions, you can click into each of the hyperlinks.
To wrap up the strategy evaluation discussion, I don’t think that Will Venable should gamify his decision making to improve the White Sox PCDMS rankings (which would be quite silly). Instead, re-focusing and re-evaluating how they use each player and attempting to lean more into putting each player in the best situation to succeed will inevitably lead to an improvement in PCDMS rankings. For example, the team can and should continue to play Jordan Leasure. He’s a young pitcher and the Sox are clearly in “what do we have mode”. However, I think that he’s shown enough that he probably shouldn’t be in higher leverage situations and perhaps they can try to use him when he is likely to face more of a mix of batters rather than a right handed heavy sequence.
Bullpen Strategy Plan
I figured that since I am the one evaluating and critiquing the White Sox bullpen and their strategy, then it is only fair for me to offer how I’d build a bullpen use plan.

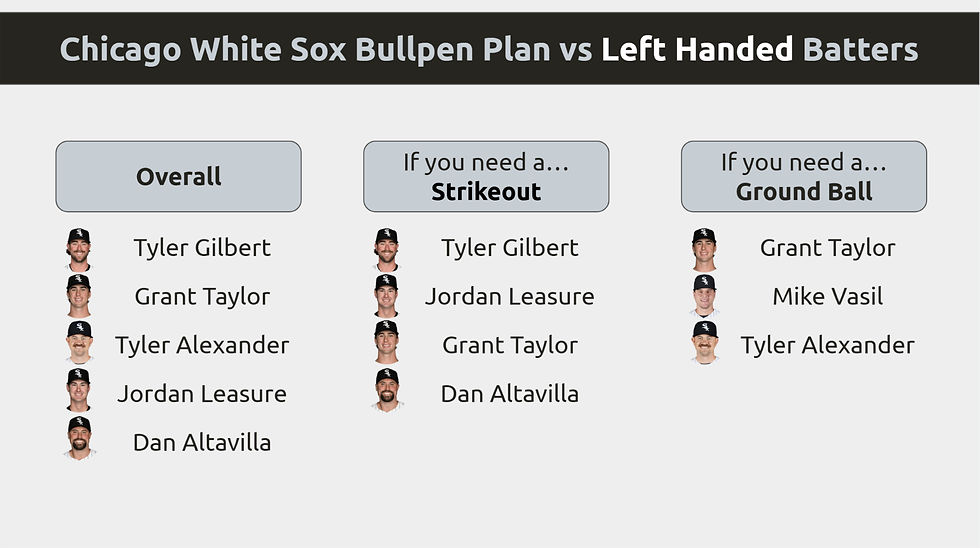
From an overall perspective, I think that the White Sox should primarily seek to have pitchers who perform better against RHBs primarily face RHBs and for pitchers who perform better against LHBs primarily face LHBs. So, I think that given the data we now have for this season, as well as historical performance, Will Venable should have enough information on hand to put his guys in a position to succeed. Now, I totally understand that there are other things at play. As I mentioned earlier, we all know that the White Sox are not contending for the playoffs and are balancing trying to develop guys like Grant Taylor, Jordan Leasure, and Mike Vasil while also seeing if they can flip anyone at the deadline (seems highly unlikely but worth noting). So, I don’t totally fault Venable for giving Leasure or Vasil run in unfavorable matchups. But I would like to see a little more preference for deploying them when the matchups are favorable. For Grant Taylor specifically, I know the sample size is small and there may be limitations on how many innings he throws this year, but I think they should continue to use him often and to test him against more difficult batter sequences. Let’s see what he has and allow him to have the room to fail fast. Circling back to the plan above, I think it’s a good starting point for Venable and the team. Obviously they shouldn’t follow it to a “t”, but it is grounded in data and could hopefully lead to more favorable outcomes and thus more wins!
Closing Thoughts
Thanks for checking the post out. It’s the first of its kind and I hope to do this again at the end of the year. I’ll admit that I felt a bit silly diving into the White Sox, but they are my favorite team as well as the team that I am most familiar with, so I felt that it was appropriate. I may do other team breakdowns in the future, but we will see!
As a final plug, you can check out the Pitching Change Decision Making Score dashboard here and if you want to pretend to be Will Venable, or your favorite manager, while considering a pitching change, you can model different matchups and decisions for yourself here.
Data Sources:
FanGraphs (go support them)
MLB Statcast Data via pybaseball
Tables inspired by Owen Phillips


Comments